Grafana Tempo
Grafana is the most popular open-source observability stack. PURISTA integrates naturally through the OTLP protocol — traces go to Tempo, logs to Loki, and everything is visualized in Grafana dashboards.
Install
npm install @opentelemetry/exporter-trace-otlp-http @opentelemetry/sdk-trace-node \
            @opentelemetry/exporter-metrics-otlp-http @opentelemetry/sdk-metrics \
            @opentelemetry/api
TypeScript setup
Grafana Tempo accepts traces via OTLP HTTP. Metrics can flow through OTLP as well.
import { OTLPTraceExporter } from '@opentelemetry/exporter-trace-otlp-http'
import { OTLPMetricExporter } from '@opentelemetry/exporter-metrics-otlp-http'
import { metrics } from '@opentelemetry/api'
import { MeterProvider, PeriodicExportingMetricReader } from '@opentelemetry/sdk-metrics'
import { SimpleSpanProcessor } from '@opentelemetry/sdk-trace-node'

export function getSpanProcessor() {
  return new SimpleSpanProcessor(
    new OTLPTraceExporter({
      url: process.env.OTEL_EXPORTER_OTLP_ENDPOINT ?? 'http://localhost:4318/v1/traces',
    })
  )
}

export function setupMetrics(appName: string) {
  const meterProvider = new MeterProvider({
    readers: [
      new PeriodicExportingMetricReader({
        exporter: new OTLPMetricExporter({
          url: process.env.OTEL_EXPORTER_OTLP_METRICS_ENDPOINT ?? 'http://localhost:4318/v1/metrics',
        }),
        exportIntervalMillis: 5000,
      }),
    ],
  })
  metrics.setGlobalMeterProvider(meterProvider)
  return meterProvider
}
Wire it into your application:
import { getSpanProcessor, setupMetrics } from './tracing.js'
import { AmqpBridge } from '@purista/amqpbridge'

const spanProcessor = getSpanProcessor()
const meterProvider = setupMetrics('my-app')
const meter = meterProvider.getMeter('my-app')

const eventBridge = new AmqpBridge({ spanProcessor, metrics: { meter } })
await eventBridge.start()

const myService = await myV1Service.getInstance(eventBridge, {
  spanProcessor,
  metrics: { meter },
})
await myService.start()
Log + trace correlation
PURISTA’s structured logger emits JSON with traceId and spanId fields. Loki can parse these fields, making every log entry a clickable link to its corresponding Tempo trace — cross-signal correlation out of the box.
Run it locally
The PURISTA repository includes a ready-made example in examples/fullexample.
# Start Grafana, Tempo, Loki, and the OTLP collector
npm run grafana:up
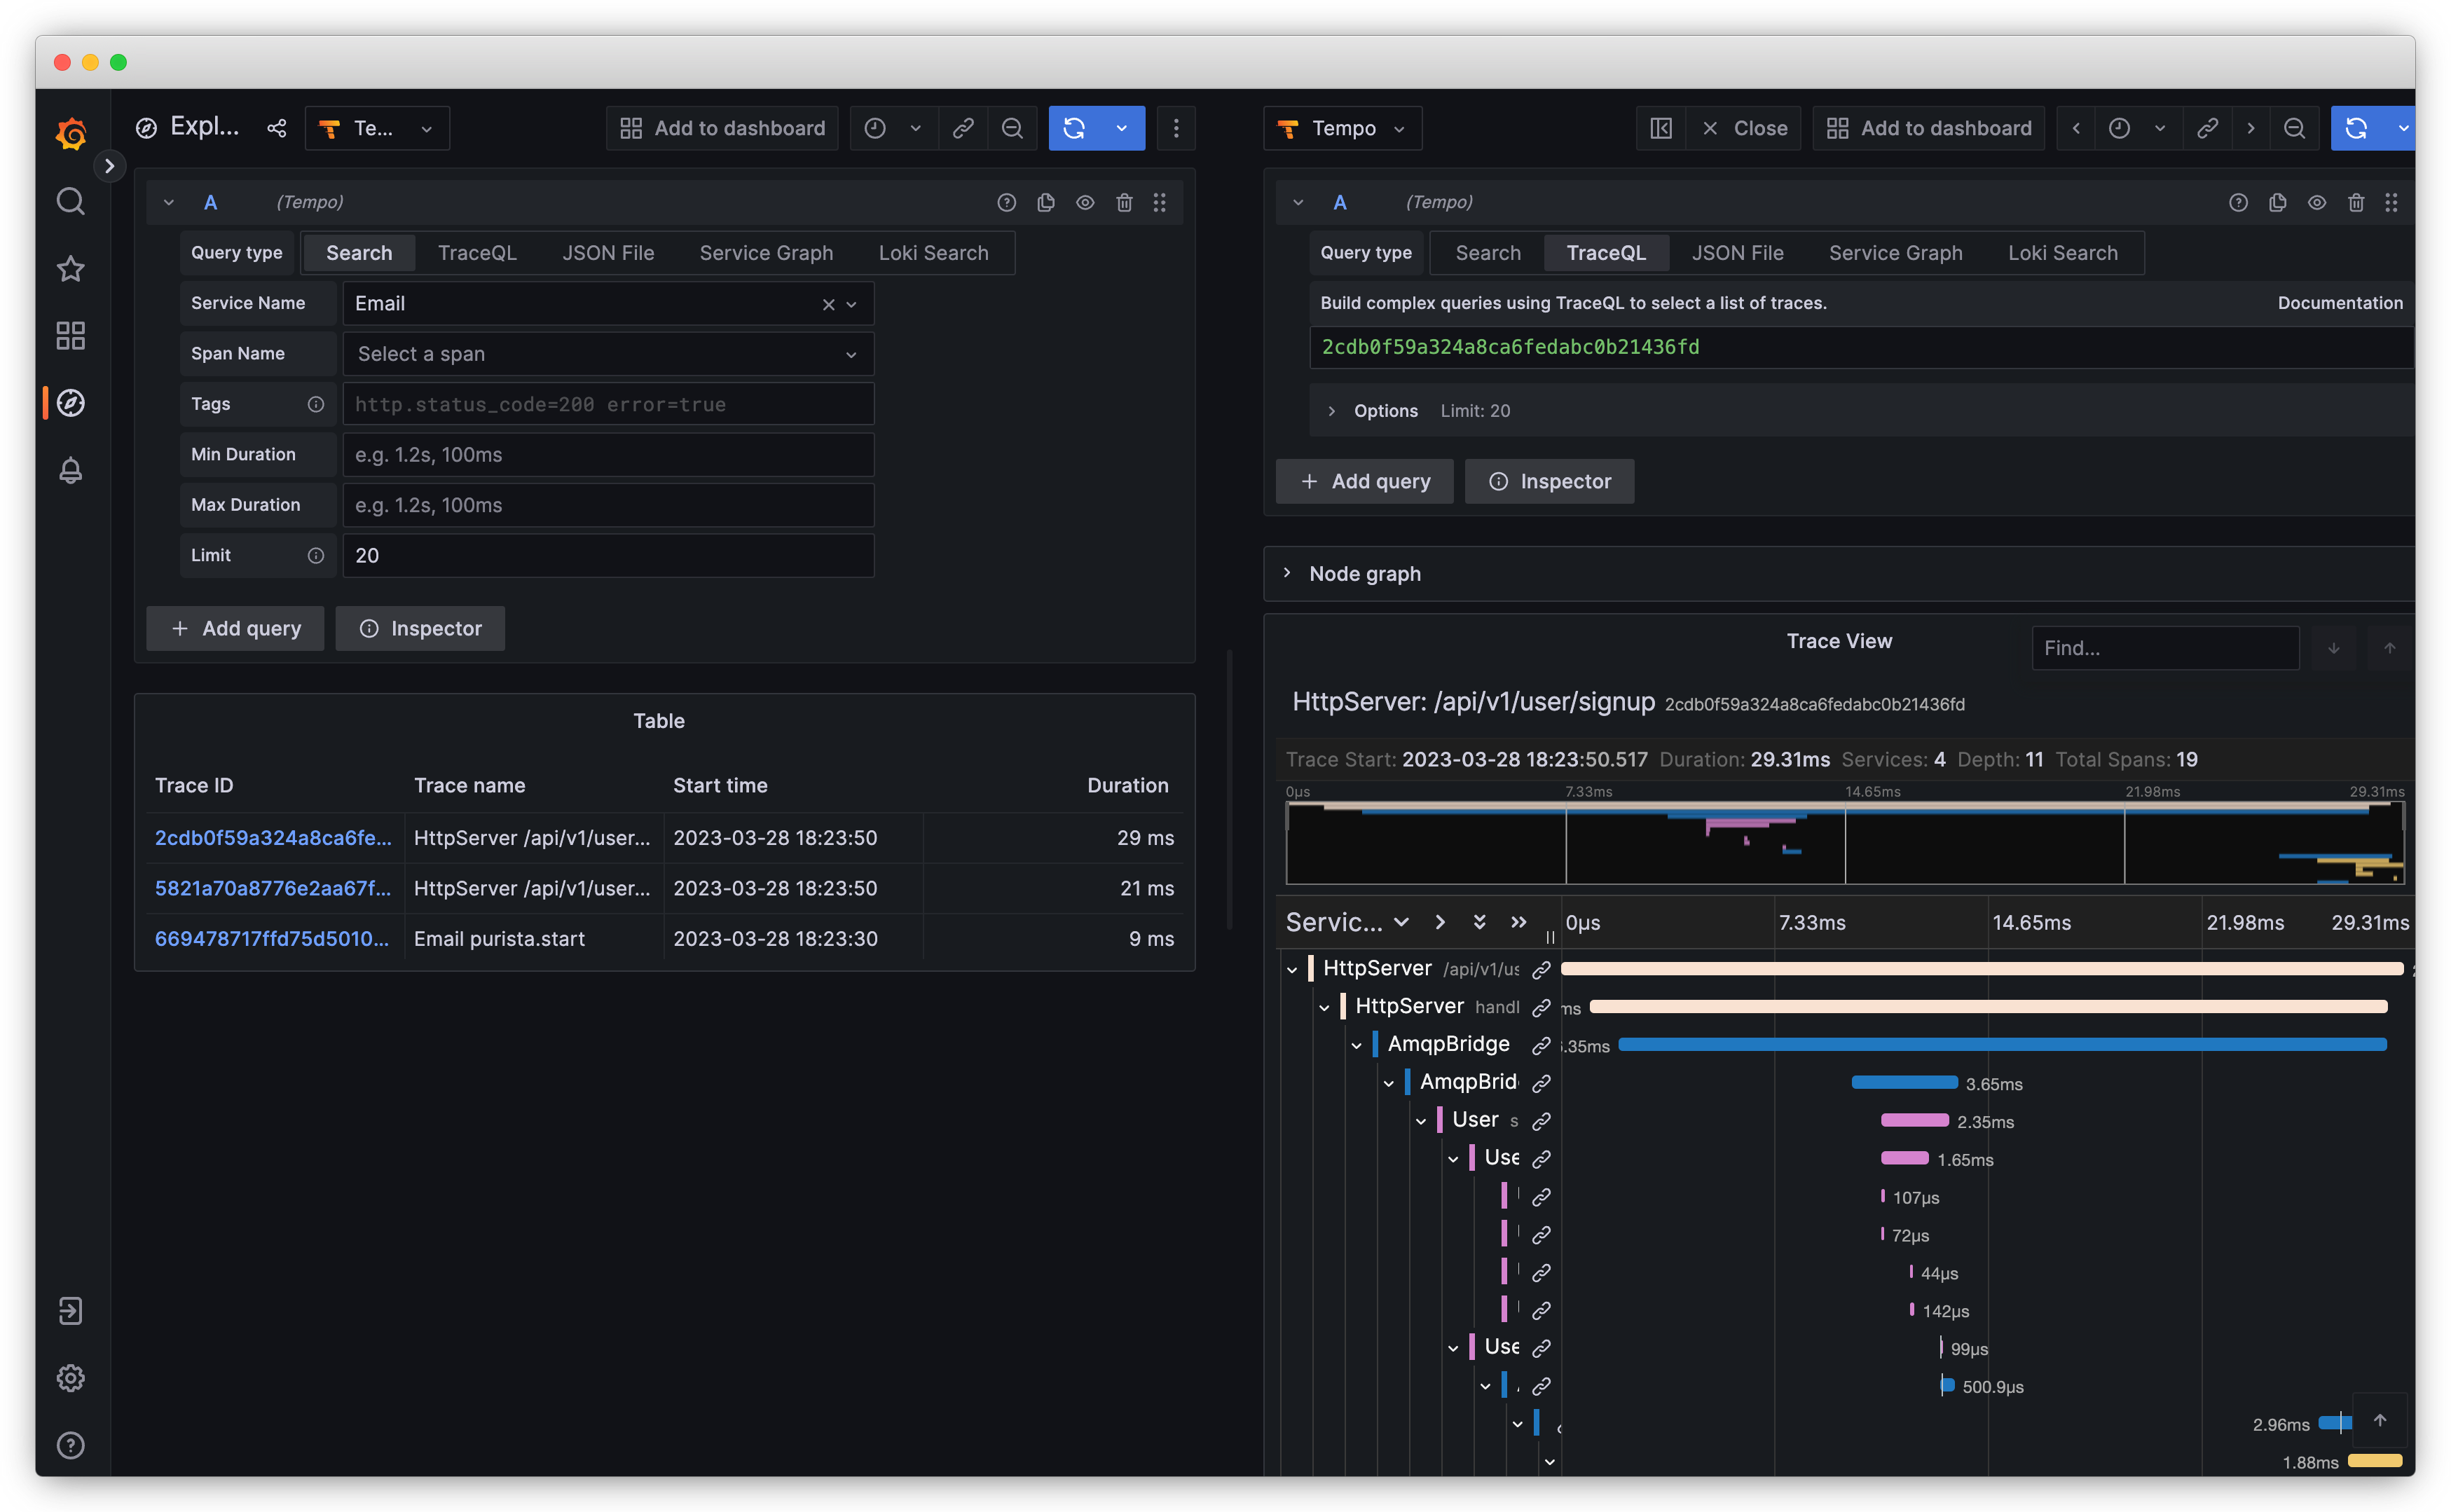
Open Grafana at http://localhost:3000, go to Explore, and select Tempo.
# Start the example application
npm run grafana:start
Go to the OpenAPI UI at http://localhost:8080 to trigger commands and generate traces. Switch to Loki to see correlated logs — each log entry links directly to its trace in Tempo.
# Stop and clean up
npm run grafana:down