Teletrace
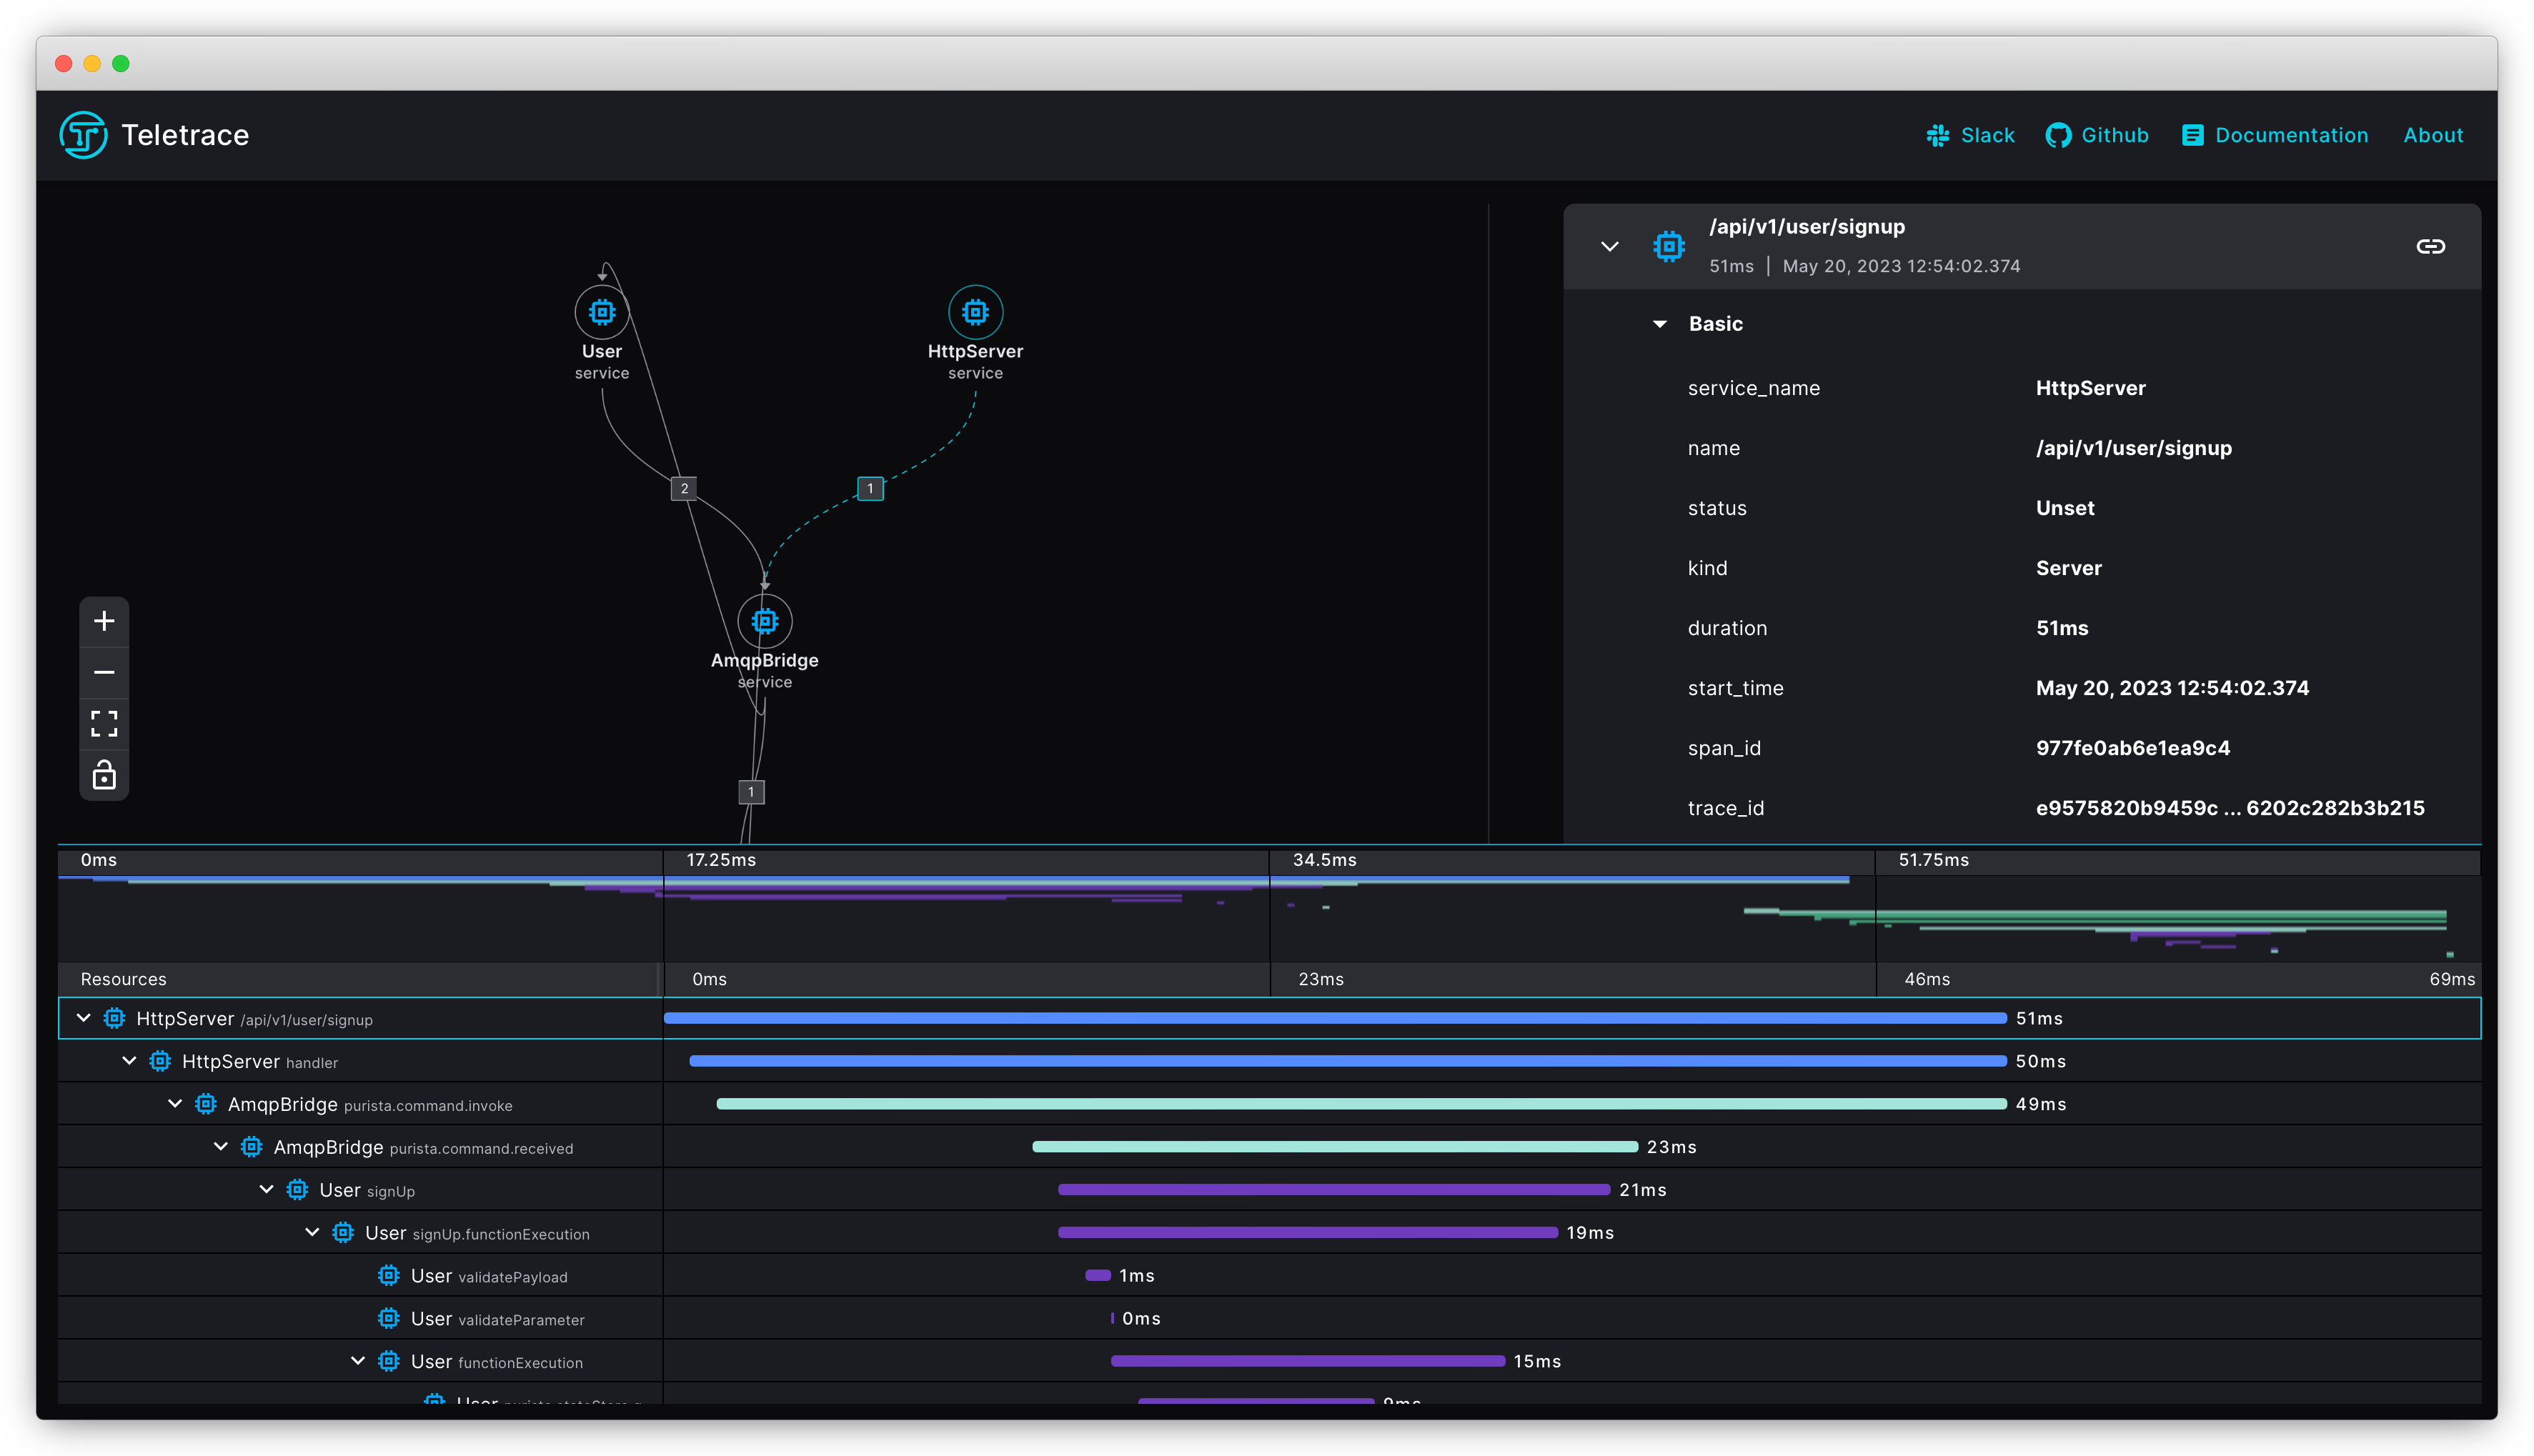
Teletrace is a lightweight open-source trace storage and viewer. It accepts OTLP and provides a minimal UI focused purely on trace inspection — ideal when you want something simpler than Grafana or SigNoz.
Install
npm install @opentelemetry/exporter-trace-otlp-http @opentelemetry/sdk-trace-nodeTypeScript setup
Teletrace accepts OTLP HTTP on port 4318, identical to Jaeger and SigNoz.
import { OTLPTraceExporter } from '@opentelemetry/exporter-trace-otlp-http'
import { SimpleSpanProcessor } from '@opentelemetry/sdk-trace-node'

export function getSpanProcessor() {
  return new SimpleSpanProcessor(
    new OTLPTraceExporter({
      url: process.env.OTEL_EXPORTER_OTLP_ENDPOINT ?? 'http://localhost:4318/v1/traces',
    })
  )
}
Wire it into your application:
import { getSpanProcessor } from './tracing.js'
import { AmqpBridge } from '@purista/amqpbridge'

const spanProcessor = getSpanProcessor()

const eventBridge = new AmqpBridge({ spanProcessor })
await eventBridge.start()

const myService = await myV1Service.getInstance(eventBridge, { spanProcessor })
await myService.start()
Run it locally
The PURISTA repository includes a ready-made example in examples/fullexample.
# Start Teletrace
npm run teletrace:up
Open the Teletrace UI at http://localhost:8081.
# Start the example application
npm run teletrace:start
Go to the OpenAPI UI at http://localhost:8080 to trigger commands.
# Stop and clean up
npm run teletrace:down