Jaeger
Jaeger is an open-source, end-to-end distributed tracing system originally built at Uber. It is the simplest way to get started with tracing locally — a single Docker container is all you need.
Install
npm install @opentelemetry/exporter-trace-otlp-http @opentelemetry/sdk-trace-nodeTypeScript setup
Jaeger accepts traces via the OTLP HTTP protocol on port 4318.
import { OTLPTraceExporter } from '@opentelemetry/exporter-trace-otlp-http'
import { SimpleSpanProcessor } from '@opentelemetry/sdk-trace-node'

export function getSpanProcessor() {
  return new SimpleSpanProcessor(
    new OTLPTraceExporter({
      url: process.env.OTEL_EXPORTER_OTLP_ENDPOINT ?? 'http://localhost:4318/v1/traces',
    })
  )
}
Wire it into your application:
import { getSpanProcessor } from './tracing.js'
import { AmqpBridge } from '@purista/amqpbridge'

const spanProcessor = getSpanProcessor()

const eventBridge = new AmqpBridge({ spanProcessor })
await eventBridge.start()

const myService = await myV1Service.getInstance(eventBridge, { spanProcessor })
await myService.start()
Run it locally
You need Docker and Docker Compose. The PURISTA repository includes a ready-made example in examples/fullexample.
# Start Jaeger container
npm run jaeger:up

# Start the example application pointing at Jaeger
npm run jaeger:start
Open the Jaeger UI at http://localhost:16686 and the OpenAPI UI at http://localhost:8080 to trigger some commands and generate traces.
# Stop and clean up containers
npm run jaeger:down
Docker Compose snippet
services:
  jaeger:
    image: jaegertracing/all-in-one:latest
    ports:
      - "4317:4317"   # OTLP gRPC
      - "4318:4318"   # OTLP HTTP
      - "16686:16686" # Jaeger UI
    environment:
      - COLLECTOR_OTLP_ENABLED=true
What you see
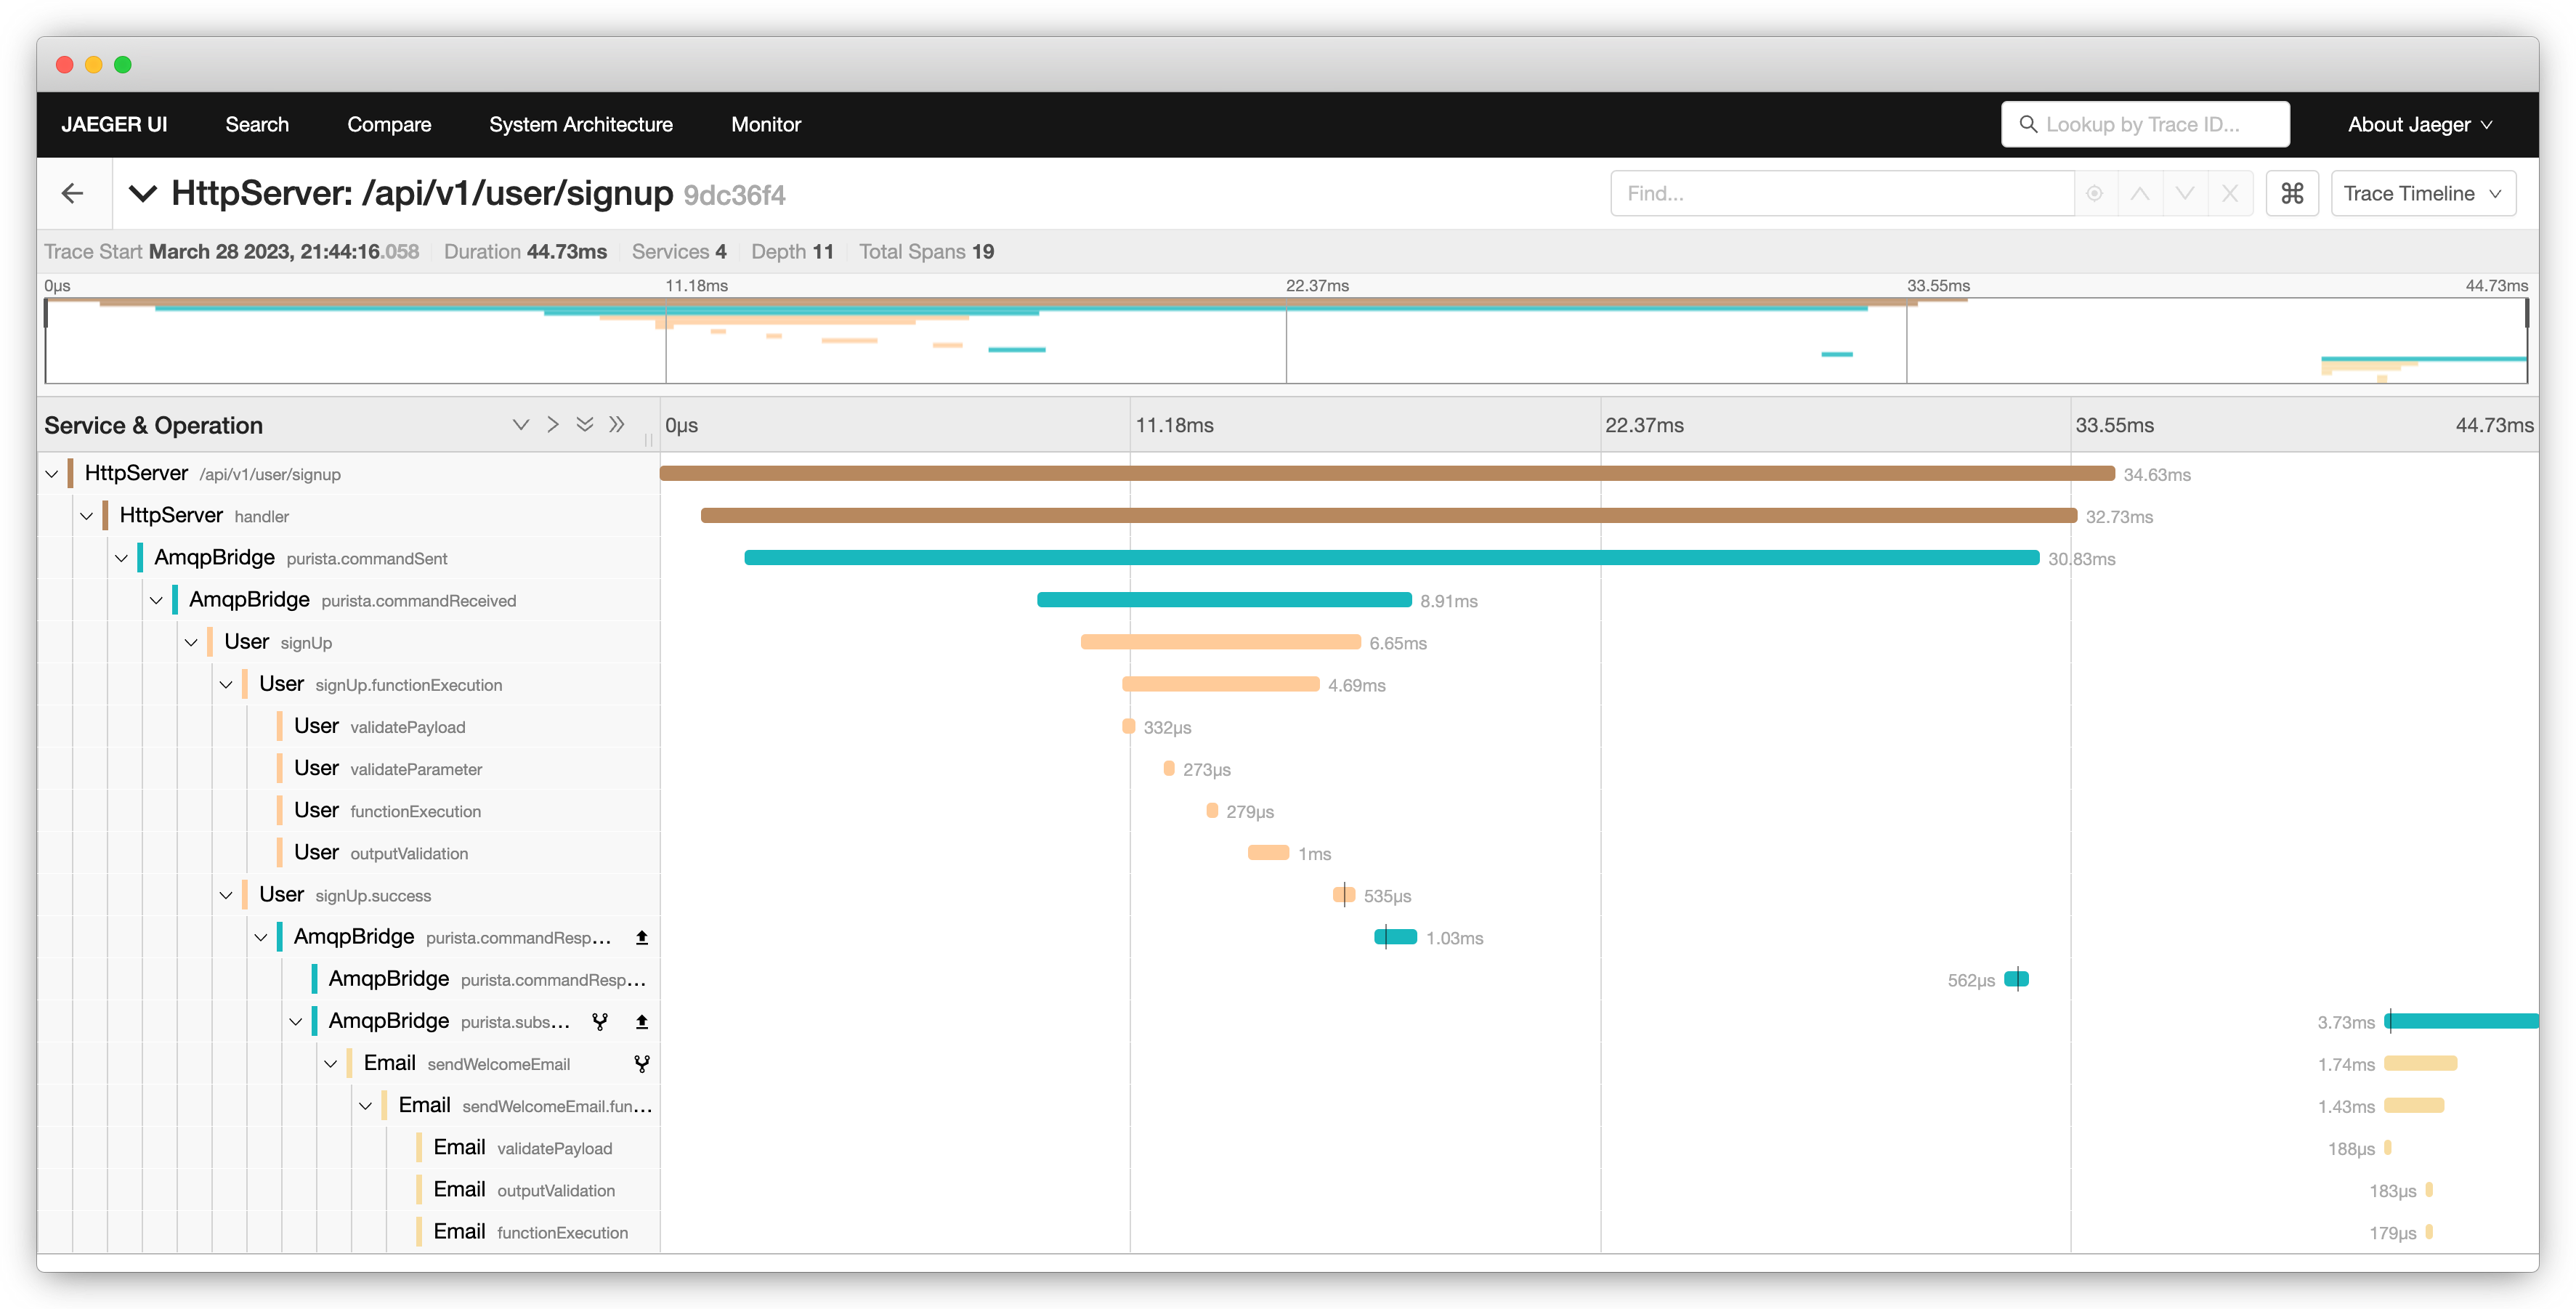
Each PURISTA message becomes a span in Jaeger. Related spans are automatically grouped under the same trace ID — you can click through the waterfall to see how a single HTTP request traverses your services.
Next steps
- Grafana Tempo — for existing Grafana stacks
- SigNoz — full observability platform with metrics and alerts
- Zipkin — lighter alternative with similar UI