Uptrace
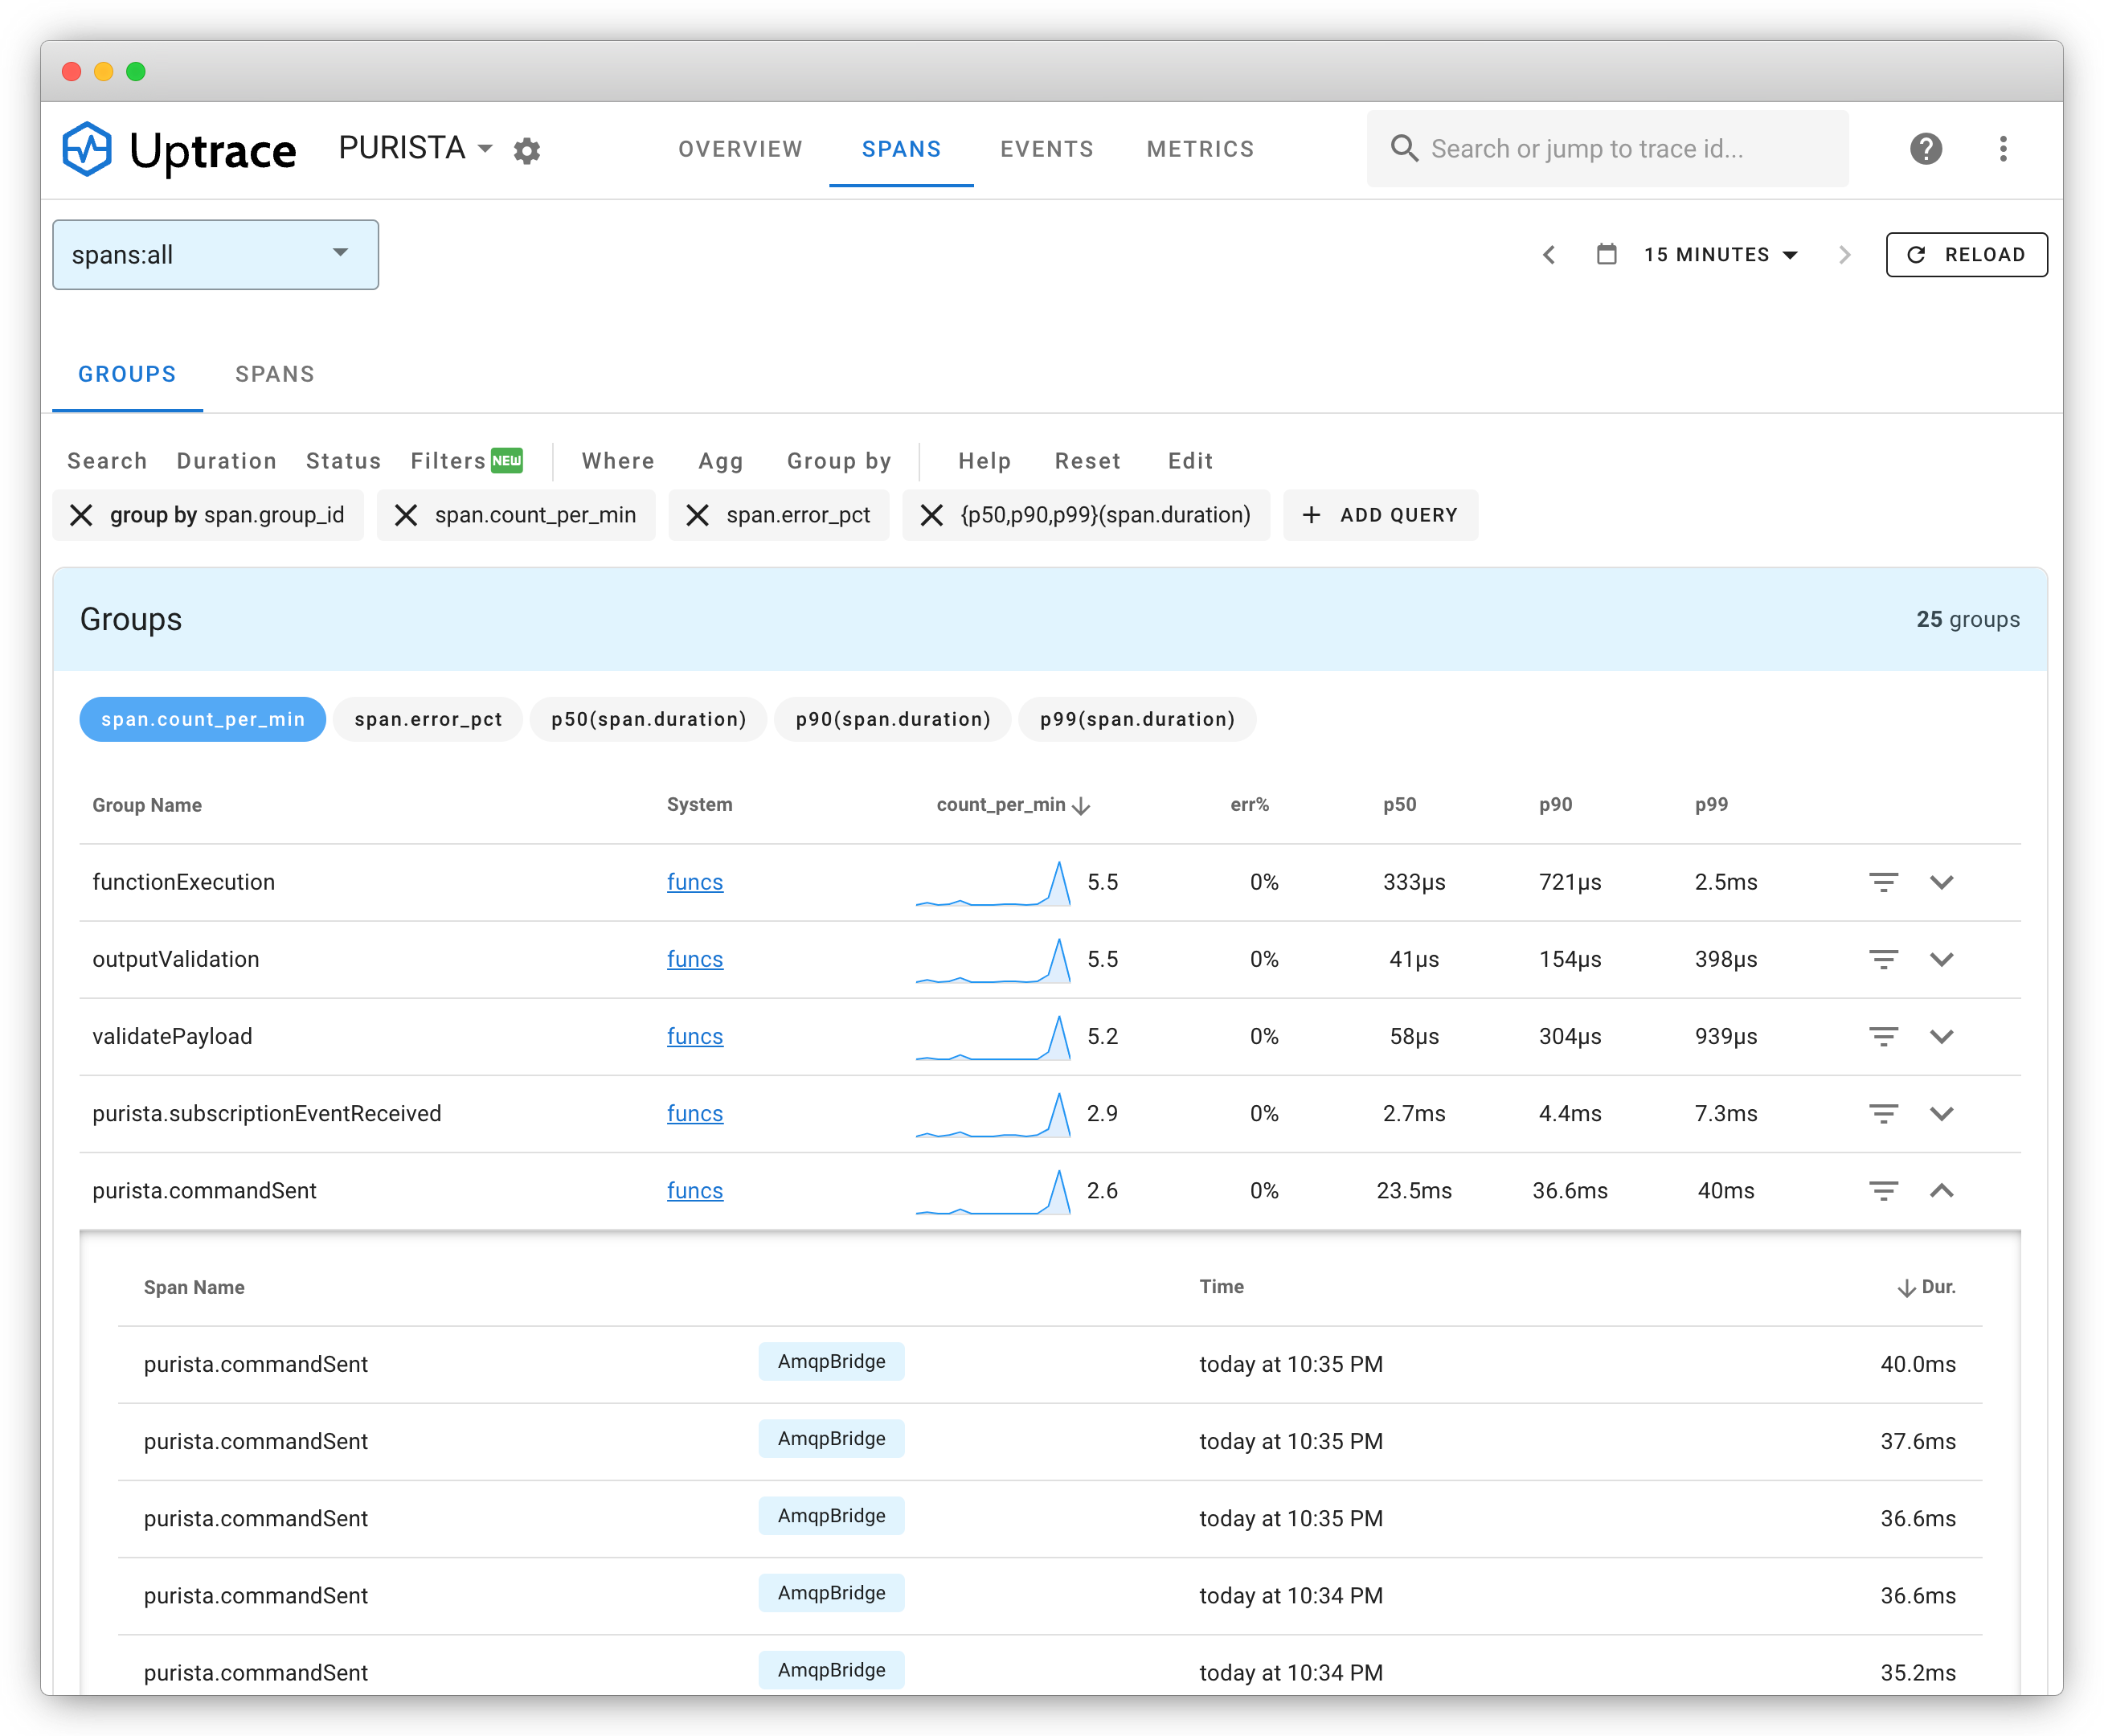
Uptrace is an open-source APM and distributed tracing tool that supports OpenTelemetry natively. It provides a clean trace UI, span groupings, and basic alerting — all self-hostable.
Install
npm install @opentelemetry/exporter-trace-otlp-http @opentelemetry/sdk-trace-nodeTypeScript setup
Uptrace accepts OTLP over HTTP. The URL includes a DSN token as a query parameter for project routing.
import { OTLPTraceExporter } from '@opentelemetry/exporter-trace-otlp-http'
import { SimpleSpanProcessor } from '@opentelemetry/sdk-trace-node'

export function getSpanProcessor() {
  // When self-hosting, the DSN is provided via environment variable
  const uptraceDsn = process.env.UPTRACE_DSN ?? 'http://project1_secret_token@localhost:14317/1'

  return new SimpleSpanProcessor(
    new OTLPTraceExporter({
      url: process.env.OTEL_EXPORTER_OTLP_ENDPOINT ?? 'http://localhost:4318/v1/traces',
      headers: {
        'uptrace-dsn': uptraceDsn,
      },
    })
  )
}
Wire it into your application:
import { getSpanProcessor } from './tracing.js'
import { AmqpBridge } from '@purista/amqpbridge'

const spanProcessor = getSpanProcessor()

const eventBridge = new AmqpBridge({ spanProcessor })
await eventBridge.start()

const myService = await myV1Service.getInstance(eventBridge, { spanProcessor })
await myService.start()
Run it locally
The PURISTA repository includes a ready-made example in examples/fullexample.
# Start Uptrace and its dependencies
npm run uptrace:up
Open Uptrace at http://localhost:14318. In the top bar, select the PURISTA project.
# Start the example application
npm run uptrace:start
Go to the OpenAPI UI at http://localhost:8080 to trigger commands and generate traces.
# Stop and clean up
npm run uptrace:down
Next steps
- Grafana Tempo — more mature log/trace correlation
- SigNoz — full observability platform with metrics dashboards