Grafana
 Official website: Grafana Labs
See it in action and try out! You will need docker and docker-compose installed at your machine. At the PURISTA repository in examples/fullexample you will find a running example:
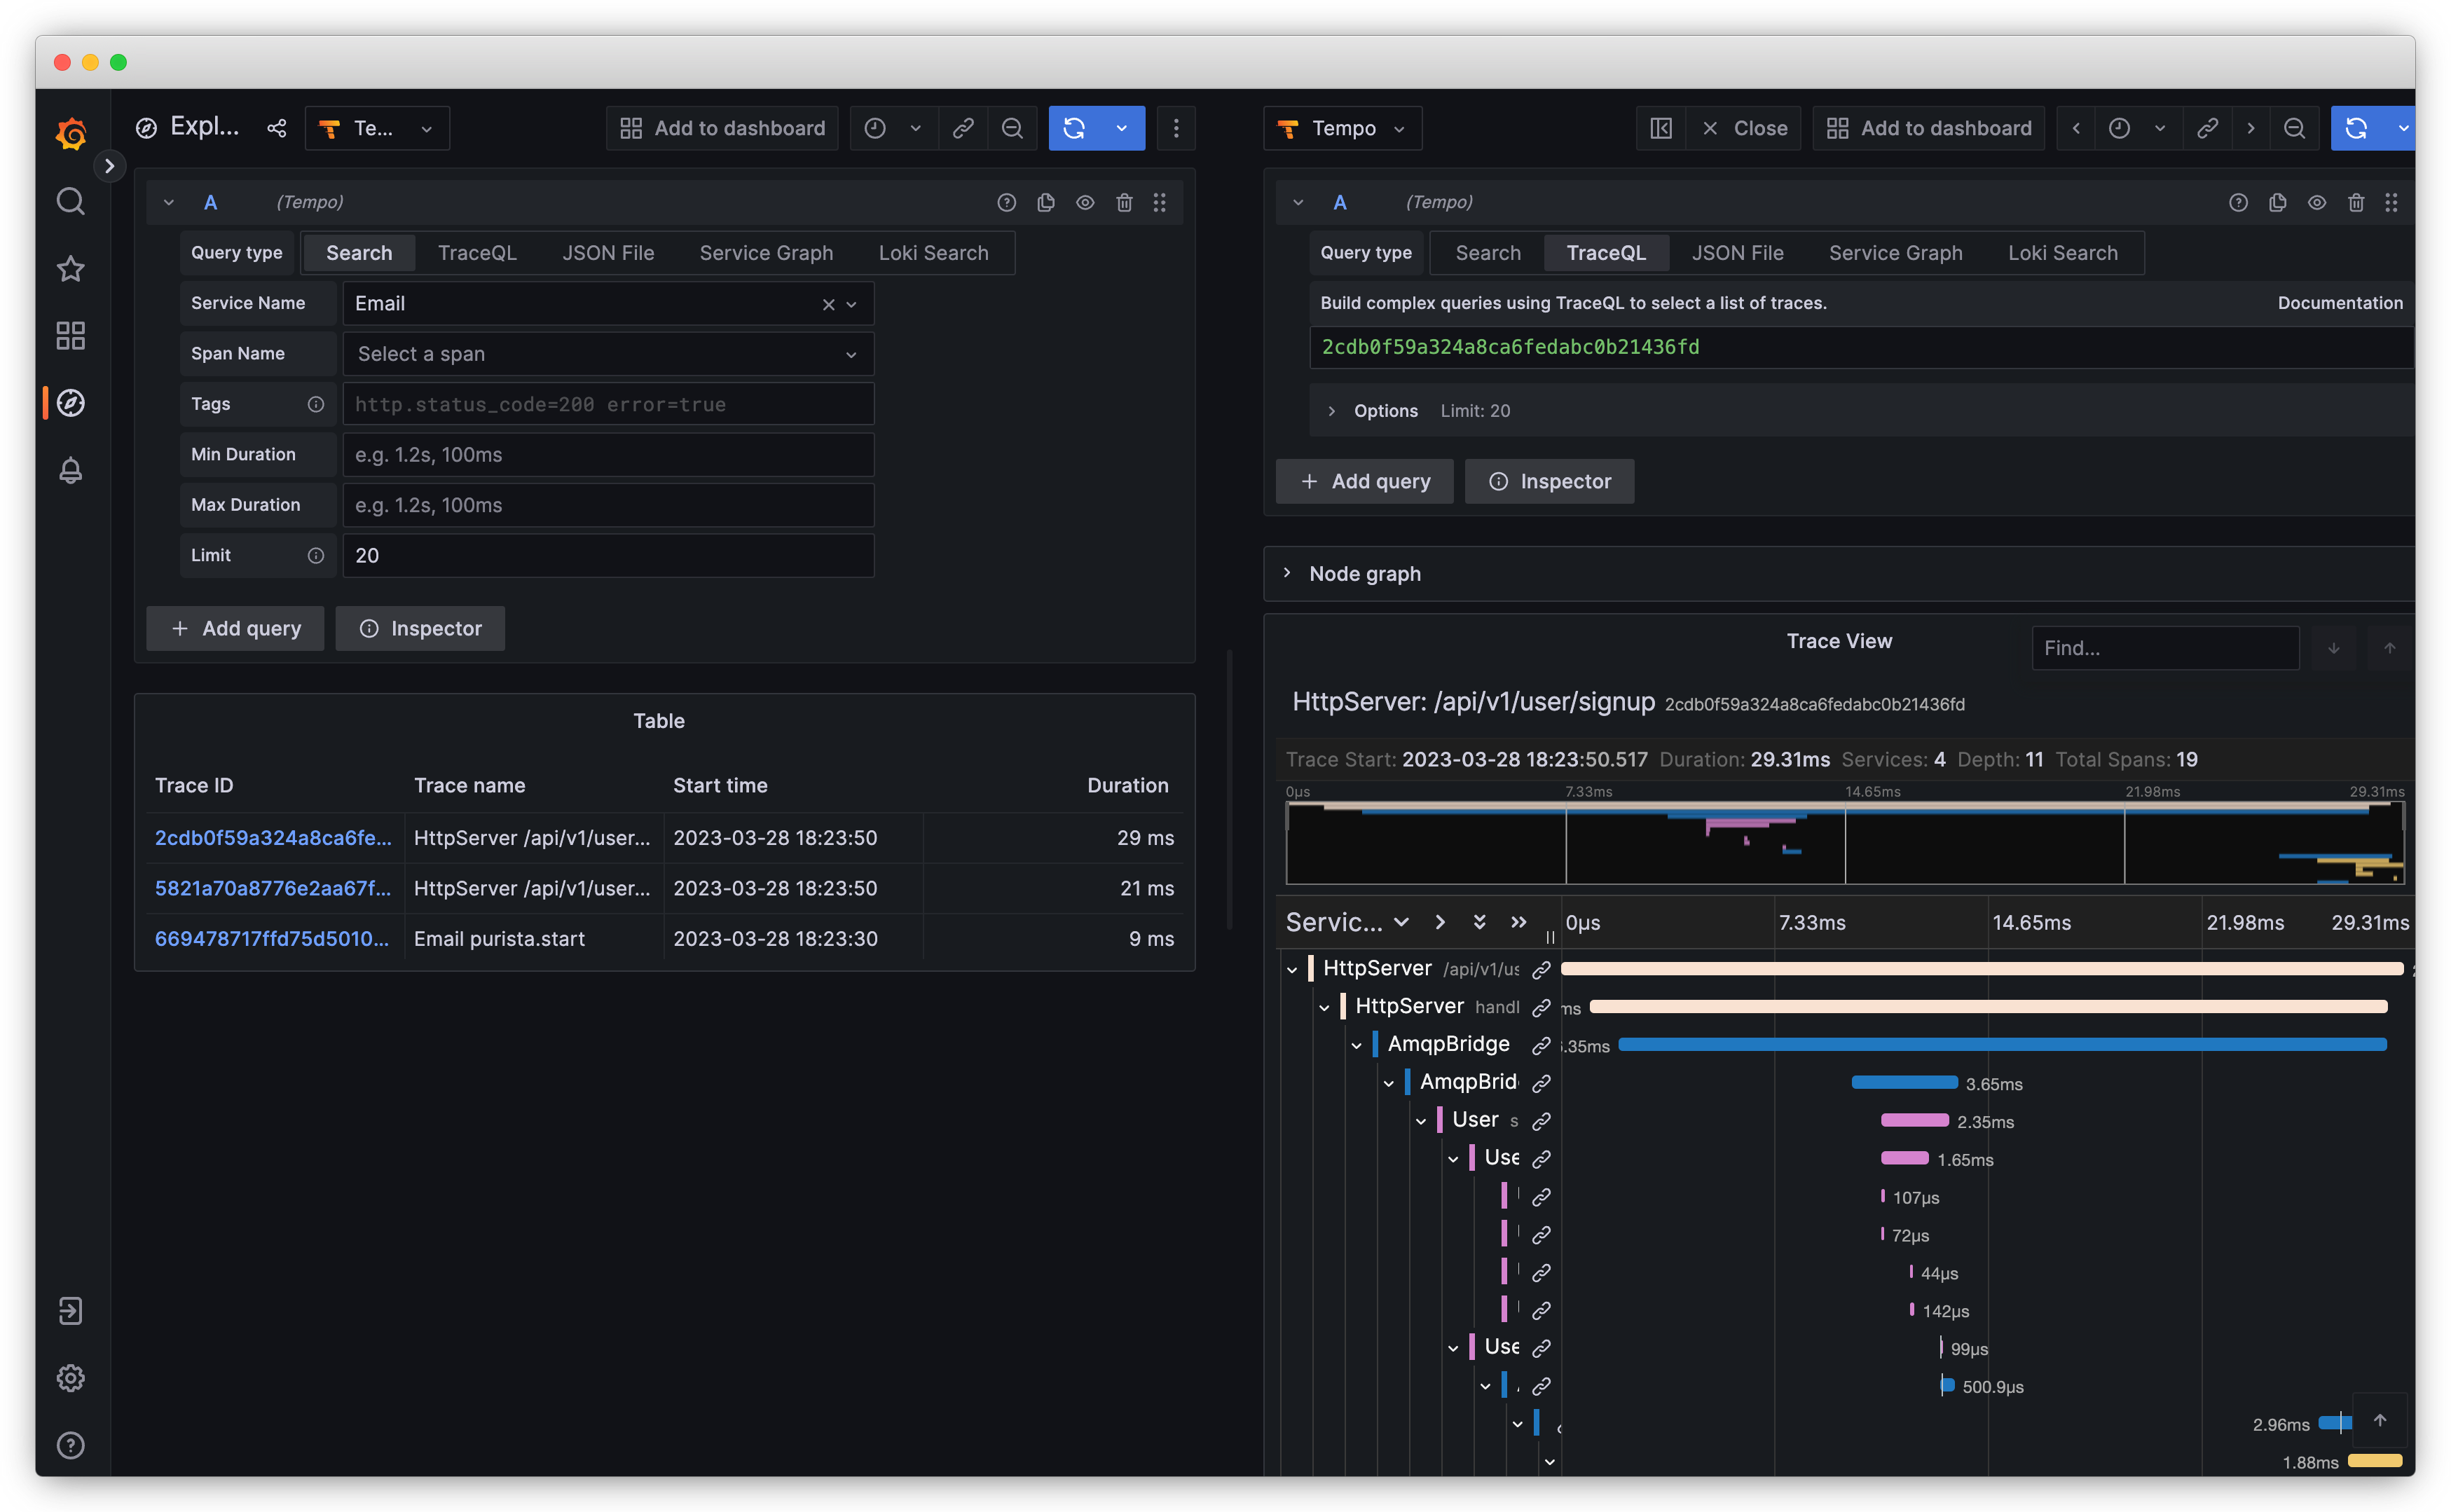
npm run grafana:upOpen the Grafana UI in your browser: http://localhost:3000 and go to page Explore and select Tempo.
Start the example:
npm run grafana:startTo generate some traces, go to the OpenAPI UI at http://localhost:8080 and call some commands. In the example, the log output is also sent to Grafana Loki and certain JSON fields are pre-configured. If you switch to Loki in the Grafana UI, you can see, that if you expand a log entry, the trace id is a link, which opens Tempo with the selected trace and span for the log entry.
To stop and cleanup and stop all docker containers:
npm run grafana:down